An oscilloscope (in short ‘scope’) is a measurement instrument that shows a graph of how an electrical signal changes over time. And is often used when working with electronics. Before you can work with it, it’s important to have an introduction.
The vertical axis of the graph represents voltage, and the horizontal axis represents time. The screen is divided in squares using lines, referred to as divisions. Both the voltage and the time scale can be adjusted to properly ‘zoom’ in or out. Zoom out to have an overview of a larger part of the signal. Or zoom in to focus on details. On a scope it’s not called zoom but sensitivity or vertical scale, expressed in Volts/division. Or time for the horizontal scale, expressed in seconds per division (milliseconds or microseconds). So one can use these knobs to have large, as well as small signals nicely fit on the screen.
Next to these scale knobs you will find the position knobs. Use these to move the horizontal or vertical origin position of the graph. Most scopes have 2 vertical input channels so they have two vertical position, and two scale (V/div.) knobs. Time for showing you an illustration of an oscilloscope.
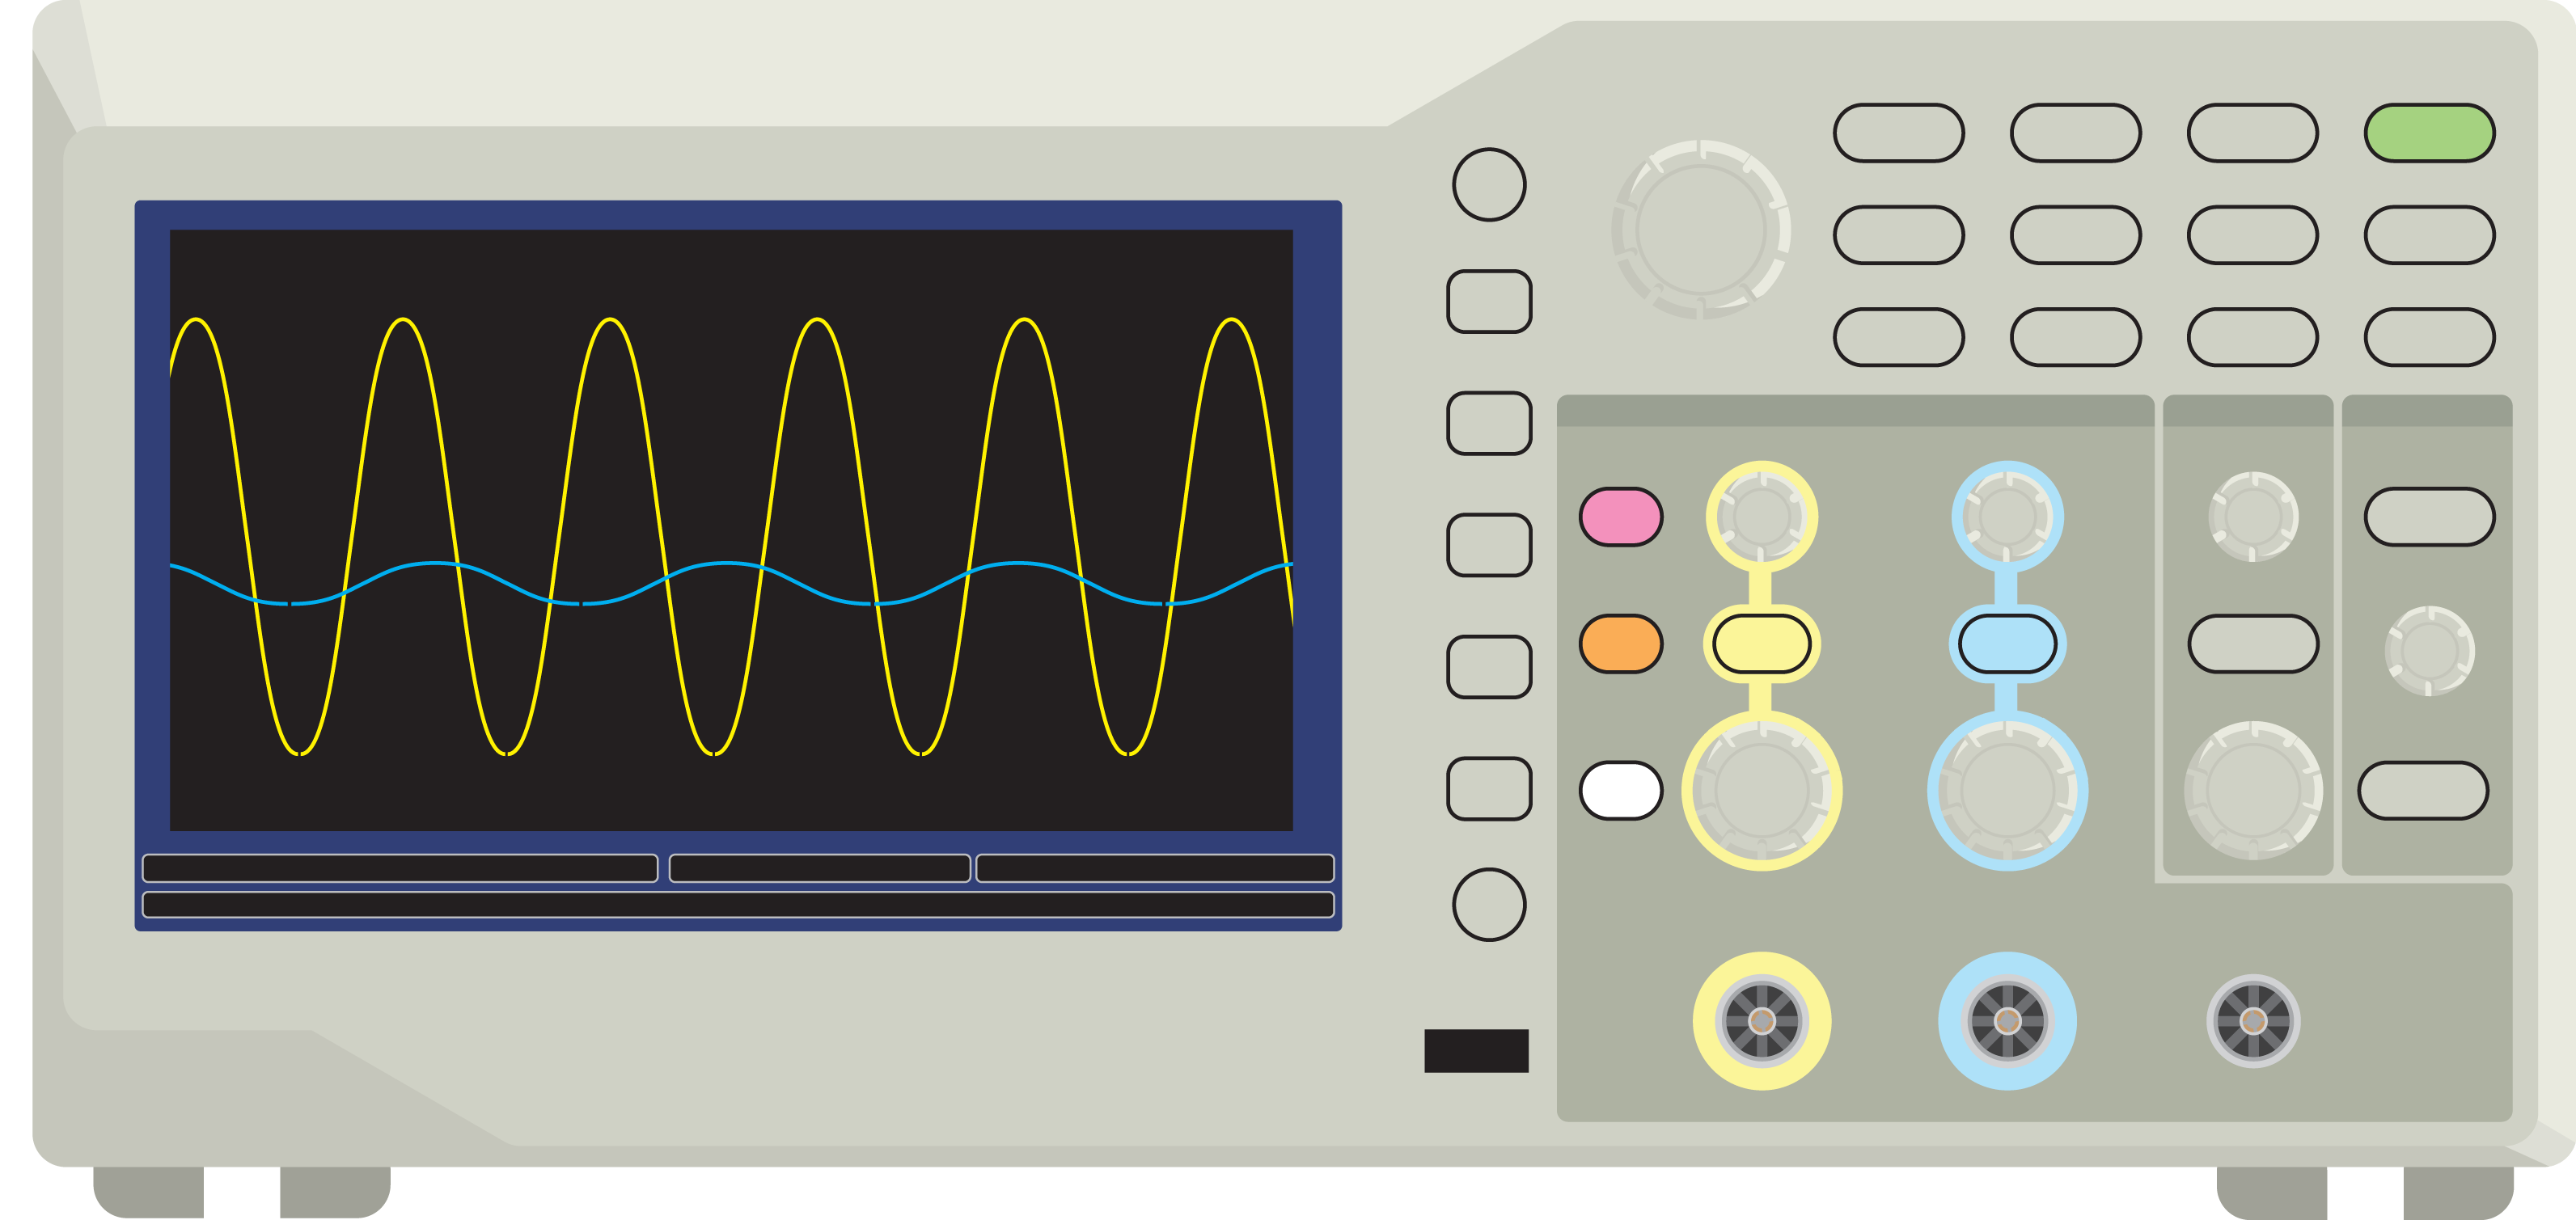
As you can see there are many buttons and dials. That’s why they are grouped together and some are color coded. In the image above the yellow indicated items are designated for channel 1, Whereas blue refers to the second channel. These colors correspond with the colors of the attached signals on the screen. This area is labelled vertical. The group, indicated just right from the blue channel, is for adjusting the so called Time Base. It contains the horizontal settings for all channels. One more group to the right you see the dials for adjusting triggering.
Triggering: synchronizing a signal on the screen.
Triggering is used to capture the signal starting at a given time. It’s like shooting a picture of a moving object on exactly the right moment. Without correct triggering the signal moves across the screen from right to left. There are different ways to trigger the scope.
The simplest is to compare the input voltage, from one of the channels, with an internal reference voltage (trigger level). Each time the input voltage meets the adjusted trigger level the image is redrawn on the screen. So triggering determines the horizontal synchronization of the signal on the screen.
When you have a continuous signal like the one on the picture above, triggering is more or less trivial. It does not really matter which part of the signal is shown, because the sine-wave repeats and repeats. But when you want to capture an event, a glitch, triggering might help you finding even more detail. Edge triggering is used most often in these cases and popular in digital systems; it captures the signal on a rising edge (increasing voltage over time) or falling edge (decreasing voltage). You can find these settings in the trigger menu.
Basic Trigger modes: Auto mode and Normal mode.
Auto Mode: The oscilloscope sweeps (refreshes the image on the display), even without a trigger. In fact the oscilloscope generates an asynchronous trigger that displays the signal at random times. This is a useful mode to start with.
Normal Mode: The oscilloscope only sweeps if the input signal reaches the set trigger requirements, otherwise the last acquired waveform will remain on the display.
Triggering single events.
When we want to capture single events we need to tell the scope to not keep triggering (sampling and drawing a new signal on the scope display continuously) but to only perform one single measurement once it detects a trigger event. So it’s important to set the trigger to an appropriate level. Typical applications: detect the output voltage of an occasionally activated sensor, that would otherwise be missed. Detect messages on digital communication lines like SPI or I2C. If we would use continuous measuring, the message would be displayed but then disappear quickly. An oscilloscope has a special button for single events often called ‘single’.
Triggering slow changing events; Roll-mode.
You can use the Horizontal Scan acquisition mode (also called Roll mode) to continuously monitor signals that change slowly. The oscilloscope displays waveform updates from the left to the right of the screen and erases old points as it displays new points. A moving, one-division-wide blank section of the screen separates the new waveform points from the old. This mode only works in the auto trigger mode for larger time base settings >100 ms/div or so.
Measurements and cursors.
Most scopes have the ability to automatically measure the voltage and the frequency of your input signal. But sometimes the scope fails in performing a good measurement and no measured values are displayed. This might for example happen when the input frequency of your signal is too low. In these situations you can use the cursors. Cursors are lines that can be moved about the screen to measure the time interval between two points, or the voltage-difference between two points on the display. Both are available through the cursor menu.
FFT (advanced math. function).
Fast Fourier Transformation is an algorithm that uses math to divide a measured signal it into its frequency components. The display shows how strong the individual frequency components are. Some music players on computers have something similar: The display shows a bar graph. And for lots of individual frequencies you see these bars moving, showing how strong a certain frequency (frequency band) is represented in the music. Modern oscilloscopes have something similar. It can be used to find dominant frequencies in a signal.
How to perform a measurement.
Written for the Tektronix TBS 1052 as used in the E-lab, but applicable also for other oscilloscopes.
Use the power on/off button to switch on the device. This button can be found on the top side of the scope. A scope is basically a computer so yes it takes some time to start up.
In the mean time connect a BNC cable to the input terminal. Connect the other end of the BNC cable to your circuit. This other end usually has a hook or crocodile clips. Connect the black crocodile clip to the ground, or common, of your circuit. With the other wire e.g. the red crocodile clip, you can measure on different nodes in your circuit.
Press the button called Autoset. By doing this the scope will automatically select settings suitable for the signal. After a while a signal should be displayed on the screen.
Adjusting how a signal is displayed.
Select the appropriate input channel for triggering (triggering menu).
You can use the Run/Stop button to stop the scope from acquiring a new image. When the button is lit green, the scope keeps on updating. When the button is lit red, the image is frozen.
Press the numbered button for adjusting some basic settings for the appropriate channel e.g. 1 for channel one. A menu pops up on the right hand side of the screen. Most settings can be kept default. But one setting is very important, and influences much on what you see: Coupling AC/DC. Use the large multipurpose dial to choose between DC/AC/Ground. With the multipurpose knob you can turn and push to select and activate your choice.
- When AC is selected the display only shows the AC (Alternating Current) part of signals. A capacitor in series with the input blocks DC signals that might be part of the signal you are measuring. Use this setting when studying a (small) alternating signal that has a (large) DC part.
- When DC is selected Both AC and DC parts are displayed. You always see the complete signal.
- The Ground setting can be used to set the zero Volt level (vertical origin) on a certain position on the display. Don’t forget to switch back to the AC or DC setting afterwards. There is another way of recognizing the zero Volt level on the display: On the left hand side on the screen, you see two color coded (yellow and blue) arrows. These arrows point to the zero Volt level for each channel. Move the position knobs to see what happens.
It’s highly recommended to watch some of the video’s (see Read more section on this page).
Limitations of an oscilloscope.
The maximum input voltage of the inputs is an important limitation. This is often mentioned above the BNC input terminals.
The next one is the maximum frequency of the input signal. This needs some more detailed explanation. First there is the bandwidth limitation of the input amplifier of the oscilloscope. You mostly can find this information above the display. But even more important. The highest frequency that a digitizing oscilloscope can measure without errors is one-half the sample rate. This frequency is called the Nyquist frequency. To put it simple; you need enough samples to be able to reconstruct a signal in a proper way. If you don’t, you might get so called aliasing (distortion or incorrect reconstruction of the signal (the image on the screen does not correspond anymore with the actual signal).
Another specification of an oscilloscope is the input impedance (as ‘seen’ at the BNC inputs). For most scopes it is 1 MΩ in parallel with 20 pF. Keep in mind that when connecting this input to your circuit you connect this 1 MΩ resistor, parallel to your circuit. That might in some situations be a limitation or better a load to your circuit.
Having Problems?
If you do not see a signal, check the following:
– Is the channel on? Press the channel buttons with 1 or 2 on it to find out.
– Is the waveform off screen? Adjust the vertical or horizontal position and scale. Or adjust vertical coupling (AC/DC) if the signal has a large DC component, moving your signal out of the display borders.
If the scope image is not completely stable, triggering on another channel might help.
If your you are in doubt about your scope or the connected test leads being OK? Connect one end of the BNC cable to the so called ‘Probe Comp’ terminals. These are officially meant to calibrate special scope test leads, called probes. But they can also be used to simply test any connected test lead. Be sure to connect both wires (e.g. both crocodile clips or hooks). Then press the Autoset button. A nice square-wave should appear on the screen. If this is not the case. Check the leads or ask assistance.